FST BLOG
On the effect of Black Swans on projects
- 25 March 2020
- Business
- Alan Mosca

In Project Risk Analysis it is very common to use the Program Evaluation and Review Technique (PERT) and other similar methods to estimate risk. This methodology utilises a probability distribution to represent the possible duration of an activity in a project. This is in direct contrast with the Critical Path Methodology (CPM), where durations and sequences are entirely deterministic and only have one possible value. By using probability distributions and combining them appropriately based on the project schedule, PERT allows practitioners to model uncertainty in a way that wasn’t previously possible.
However, a certain set of assumptions is made in PERT about these distributions, when they are manually picked and assigned by experts on a project. This has the consequence that all events with low probability and high impact are ignored and therefore considered impossible. Such “Black Swan” events are all around us, and happen with incredible frequency, both in projects and everyday life. I try to illustrate the problem, and explain how the nPlan framework is different.
Black Swans
In his seminal book “The Black Swan”, Nassim Taleb describes a Black Swan as an event with three fundamental properties:
- It is an event with very low probability of occurring
- It is an event with a disproportionate amount of impact and consequence
- It is an event that cannot be predicted, but is nonetheless often post-rationalised and explained as a higher probability phenomena
A low probability event is by definition, something that is not very likely to happen. Think of the likelihood of bumping into William Shatner on the street. Humans are particularly bad at estimating such low probabilities, and they do so by several orders of magnitude. Just ask people why they play the lottery (it is much more likely to bump into William Shatner!).

Black Swans happen in the tail of probability. For an activity, the black swans are the low probability events that can cause a lot of delay. This inability to correctly estimate low probabilities, combined with a total blindness to the fact that there are many more unknown low probability events than there are known ones, is one of the reasons why current project planning techniques are not designed to survive a Black Swan event. The very moment a potential Black Swan is identified, something will be done about it. A plan will be changed, additional resources will be allocated, or simply more attention will be paid to a certain section of a project. When we attempt to mitigate the occurrence or the effect of a Black Swan, it stops being a black swan because we are limiting its impact, and reducing its probability even further.
A thought experiment on tails
Now consider the probability distribution of the duration of an activity at the time of its planning. This probability distribution will tell us that the expected remaining duration is, say, 50 days. After 10 days have passed, this expectation may not, in fact, be 40 days. It is likely to be slightly higher. The reason for this lies in the fact that when we pass the 50 day mark, if the activity is still occurring, it cannot have a negative expectation of duration, so we have to incorporate this fact in our modelling of the expectation. In the real world, this just means that factors which increase duration are learned during the execution of the activity and not before.
If this activity were well behaved (what Taleb calls “Mediocristan”) what we would see is that the expectation of remaining duration after 60 days is less than the expectation of remaining duration after, say, 55 days. The opposite is true for activities (and indeed projects) that are badly behaved (what Taleb calls “Extremistan”). While this may seem counterintuitive for a moment, this actually means that as an activity is more delayed, we should expect it to be even more delayed. In practice, this can be thought of like this: after one day of delay, we would think “this might still be done soon”, while after a very large (say 400%) delay, we will start asking ourselves “will it ever be done?”.
If you want a real life example of just this type of problem, think of Crossrail, a new underground railway that is being build in London, originally planned for delivery in 2018 at a cost of £14.8bn and which is now projected to open in March 2021 (not by nPlan), at a cost of over £18bn — and with one station (Bond Street) delayed even further.
As Taleb describes in his book, and we have corroborated this in our dataset, projects and activities belong to this latter category, which is subject to the appearance of Black Swans, and forces the practitioner to consider the effects of probability tails.
A note about ‘tunnelling’ and the three point estimate
Some practitioners do indeed think about Black Swans and consider them to be out of scope for the purpose of risk estimation. This is a symptom of a phenomenon described in the book itself as ‘tunnelling’, where problems outside the direct control of the practitioner are discarded entirely.
On top of this the “three point estimates” (best, most likely, worst) picked for activity distributions in PERT analysis, follow the guideline that anything worse than the worst case should be around 1% likely. If we follow this definition from a strict statistical point of view, on a project with 4000 activities, 40 activities will perform worse than the worst estimate.
Combining these two notions, we find that the 1% estimates are too optimistic and several experiments, both in the literature, but also from observations made on our dataset, confirm that humans tend to vastly underestimate these tails because they are not considering external factors. Our data shows that the “worst” estimates used for PERT analysis appear to be excluding around 5%~10% of duration probability rather than the target 1% (which we believe to already be too big a number).
The Norm’s fallacy
A Black Swan usually lies in what is called “the tails” of a probability distribution — that part that is far away from the most likely events. The rest of the probability mass (the majority of all events) is what is normally considered while planning a project. These events do indeed happen the majority of the time, and we should plan for them to happen in this way, because they represent the bulk of the execution of a modern project.
Only considering typical outcomes as part of a simulation or a forecast, creates a huge blind spot. If we repeatedly sample from a distribution with a long and/or fat tail, it becomes increasingly likely that we will have low probability events materialising. When such events are unexpected and of high consequence (imagine an electrical transformer exploding), the outcome of the project itself becomes more likely to be affected.
Let’s imagine that all activities on a project only had a minuscule 0.1% to become wildly delayed by, let’s say, over 200% of the original planned duration. That’s a 99.9% probability of being under that duration. If our projects has 5000 of these activities, we should expect that, on average, 5 activities will take above 200% of their original duration. If any of these are on or near the critical path, they will have a massive impact, causing a very large cascade effect on everything planned to happen after them.
This pattern is clearly visible in the data that we have collected over the last few years. For every project that was significantly delayed, most of its activities were indeed completed successfully within their planned duration. However, the very few activities that did happen to be badly delayed, had a tremendous effect on the entire project.
The limits of PERT analysis
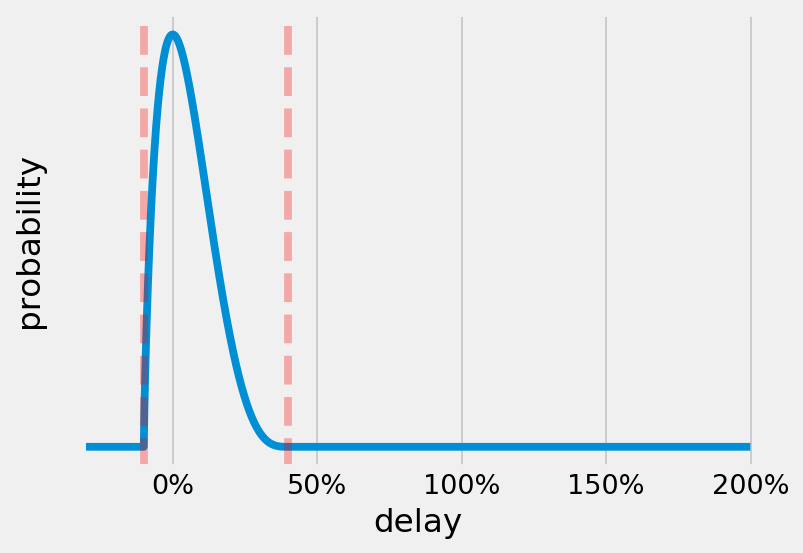
A PERT distribution with limits at -10% and +40% delay, and “most likely” as no delay.
PERT analysis is what is currently used to perform risk analysis on schedules. This is done by assigning (more on why that is bad later) a probability distribution to each activity, based on the PERT distribution. This distribution is a curve that is fitted between two limits (a minimum and a maximum) and has a peak on a “most likely” outcome.
By defining such a minimum and a maximum possible delay value for each activity using a PERT distribution, we are assigning all activities a zero probability of becoming Black Swans. This assumption creates a vulnerability, and is reflected in the fact that it is almost impossible for a large project to go according to plan.
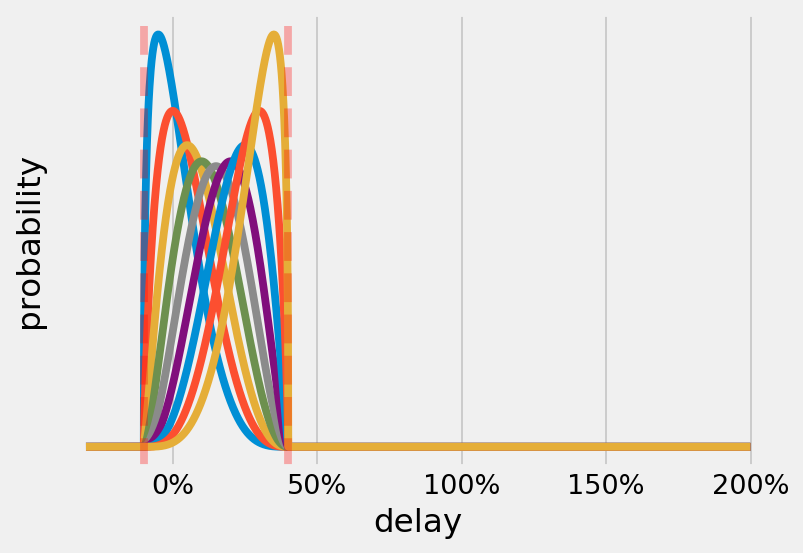
Lots of PERT distributions: No version of PERT is able to give a probability for any event beyond the given bounds
Deleting all tail probabilities also makes Black Swans more likely, because we are de facto ignoring all of them, therefore making them all possible.
PERT was a fantastic tool in the age of slide rules and mainframes, and we had to concentrate the bulk of a simulation on the core central events. Nowadays however, we are able to run much larger simulations; ones that produce correct and calibrated outputs on the tails as well.
By including the probability of each activity becoming a Black Swan, we are effectively building the mechanisms that create resilience in our plans. Black Swans will not stop happening, and we usually can’t tell which ones will happen, because the moment a prediction is made, mitigation steps are taken. Instead, we believe that the correct way is to forecast the probability of each item becoming a Black Swan individually, learning from past data and in a way that is as granular as possible, and create plans that try to minimise the impact of any Black Swan occurring.

PERT vs a simple Gaussian. In this case, we set the standard deviation of the Gaussian to be the same as the limits of the PERT and we can see that a lot of tail risk of delay is being ignored (the shaded area in blue), amounting to 15.9% of the total probability mass.
Learning the activity outcome
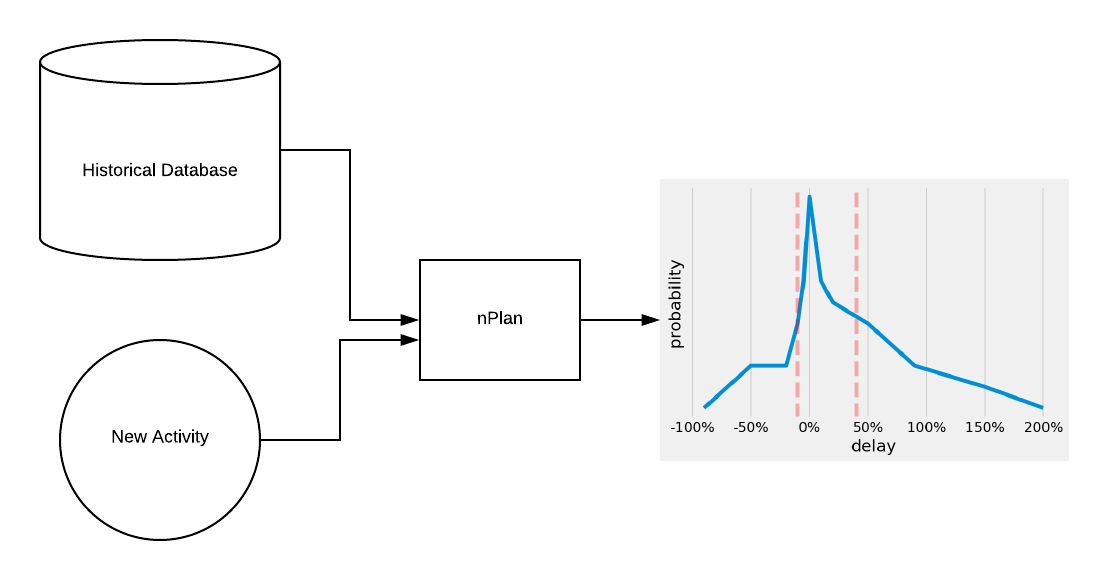
How our engine learns to output a custom distribution for each activity, based on learning from the historical dataset.
Assigning a probability distribution, even one with tails, is still however not sufficient. As much as one can believe that they have full knowledge of the possible outcomes of an activity, it is very unlikely that they will have witnessed the potential tails of the specific activity at hand. Think back to the whole array of low probability events (say 0.1%) that could have an impact in a schedule built up of thousands of activities.
By collecting a large dataset of all past schedules, it is possible to create distributions based on historical data which contain low probability events. This will then form the basis of a better estimation which does not rely on any assumptions, not even the shape of the distribution.
A different framework — confidence vs probability
Our models have learned how these events behave and are able to provide the tools to improve the resilience of plans, by carefully forecasting the probabilities of delay, rather than assigning a confidence value to a plan.
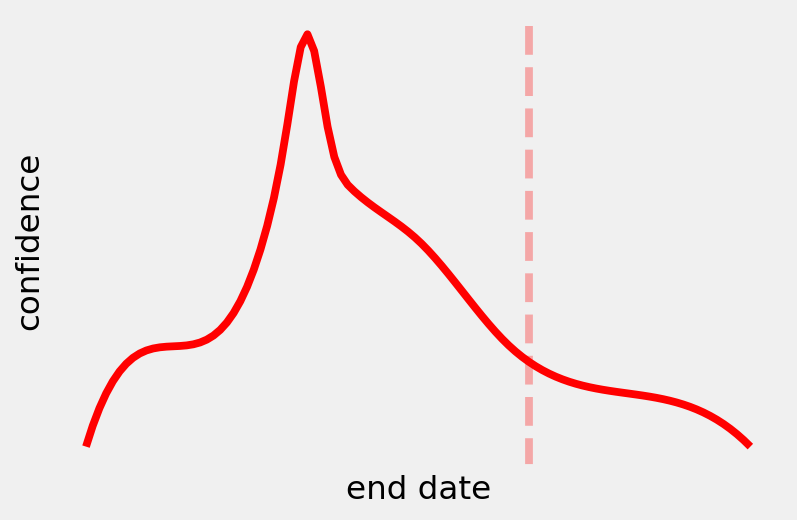
What a good result might look like when using PERT: The dashed line represents the planned end date. Most of the simulations end before the planned end and there is high confidence of completing on or before it.
When we do this, we no longer refer to confidence in the schedule, because the result is independent of how we feel about it. When we give an estimate of the probabilities for each activities, we are expressing an opinion which contains an unknown amount of epistemic uncertainty. This estimate directly dictates the results of a Monte Carlo simulation, resulting in end date values that are more expressive of our own knowledge than the actual potential outcomes. Instead, we can now refer to an actual probability of the target date which includes the effects of probabilities based on historical data, which includes Black Swans, external factors (for example client interventions), and uncertainty due to the execution.
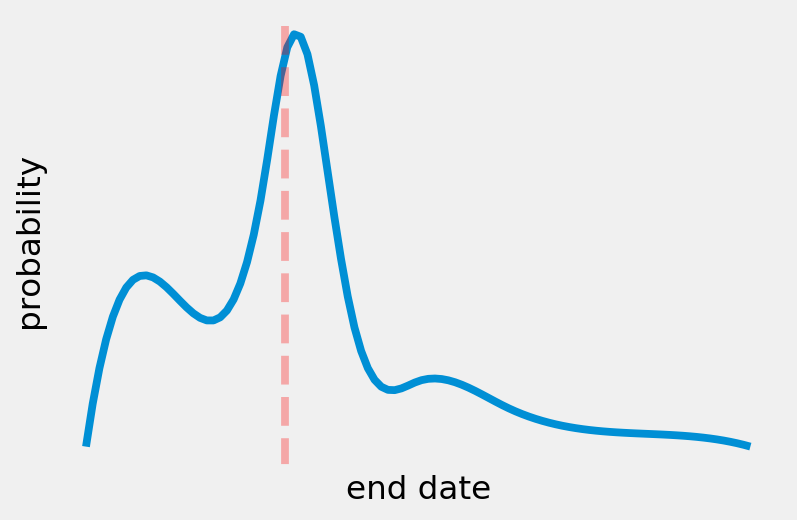
What an equivalently good schedule might look like when using tails and learned distributions. The planned end date is near the most likely simulated outcome, but there is still a probability of small delays and a certain amount of tails to the simulation results. The goal of the planner will be to structure the schedule so that the tail of this graph is contained as much as possible and the planned end is as close as possible to the most likely end date.
These probability values will have a much wider base than the confidence values provided by a standard PERT simulation, giving a more accurate estimate of the actual outcome of the project. This new information will help make informed decisions about the risk of a project. For example, a programme that gives 90% confidence in PERT may be a good programme with 70% probability of completing the project on time, or a bad one, where the probability of delivering on time is much lower.
This, and a complete change in the way the industry thinks about probabilities, will help us shake the impact of Murphy’s Law, allowing us to build larger projects with less risk.
Alan Mosca is the co-founder and CTO of nPlan. To find out more about Alan and nPlan click here.