FST JOURNAL
R&D in UK economic strategy
DOI: https://www.doi.org/ 10.53289/NLDD3971
Revising estimates of R&D spend
Grant Fitzner is Chief Economist and Director of Macroeconomic Analysis at the Office of National Statistics.
Grant Fitzner, Chief Economist and Director of Macroeconomic Analysis at the Office of National Statistics, outlined the reasoning behind a recent significant upward revision to R&D estimates by the ONS, including the actual changes that had been made, before describing the next steps to be taken.
He explained that the figures could be broken down into several categories of R&D: business, Higher Education and Government. He made the point that business accounts for around 70% of the total research and development effort in the UK, while Higher Education is around 23%, Government expenditure is 5% and the remainder comes from the nonprofit sector.
Business and Higher Education therefore dominate UK spend and activity, as is the case in most other countries. That had therefore been the main area of focus for ONS. Looking at business activity, the first part of the ONS review and subsequent revision of R&D reporting involved addressing the under-representation of small firms.
Joint work with HMRC identified which firms and which sectors were missing from ONS figures. Estimates were uplifted and reweighted. This work drove a £17.1 billion upward revision to the 2020 business R&D figures.
For Higher Education, ONS is now using Transparent Approach to Costing (TRAC) data from the Office for Students. This is providing a much better picture of R&D activity carried out within HE. It has led to a revision of around £4.9 billion in spending.
ONS has also been scrutinising Government R&D, looking particularly at micro-data from the Departments most heavily involved in this area. The results of the revised analysis here were published in April 2023.
Significant changes
So there have been quite a few changes. Figure 1 illustrates the results. The grey line shows the unrevised Gross domestic expenditure on research and experimental development (GERD). The dotted and blue lines show the previous and revised Business Enterprise R&D (BERD) while the amber line shows the revised GERD including the uplift from revised HE figures mentioned previously. These are significant upward revisions.
The Government has a target of investing 2.4% of GDP in R&D and on original estimates the UK had been tracking below that level for some time. These revisions have lifted the UK above that: in 2021, this was just under 3%, slightly better than the OECD average but still somewhere near the middle of the pack. These revised figures indicate that the country is not an outlier on the international stage.

Next steps
The first phase of this exercise was concerned with getting the overall numbers right and resulted in significant upward revisions. Phase two has involved a large expansion of the Business Survey. ONS has increased the sample size tenfold and will be publishing results from the new enhanced survey in 2024.
On Government subnational measures, a key question for the Levelling-Up agenda is where exactly the R&D spend is occurring. ONS is developing more granular data sources and working with the Government Office for Science to answer that question. International experts are helping to develop a better understanding of the UK’s alignment with international best practice in measuring the right things.
These statistics will feed into the 2024 Blue Book revisions.
Grant Fitzner noted that people started talking about R&D seriously about 30 years ago (there is a large body of literature on this subject). There has been a consistent strong correlation between R&D spend and productivity. This is of considerable interest in the UK at the moment, given the disappointing productivity performance of late.
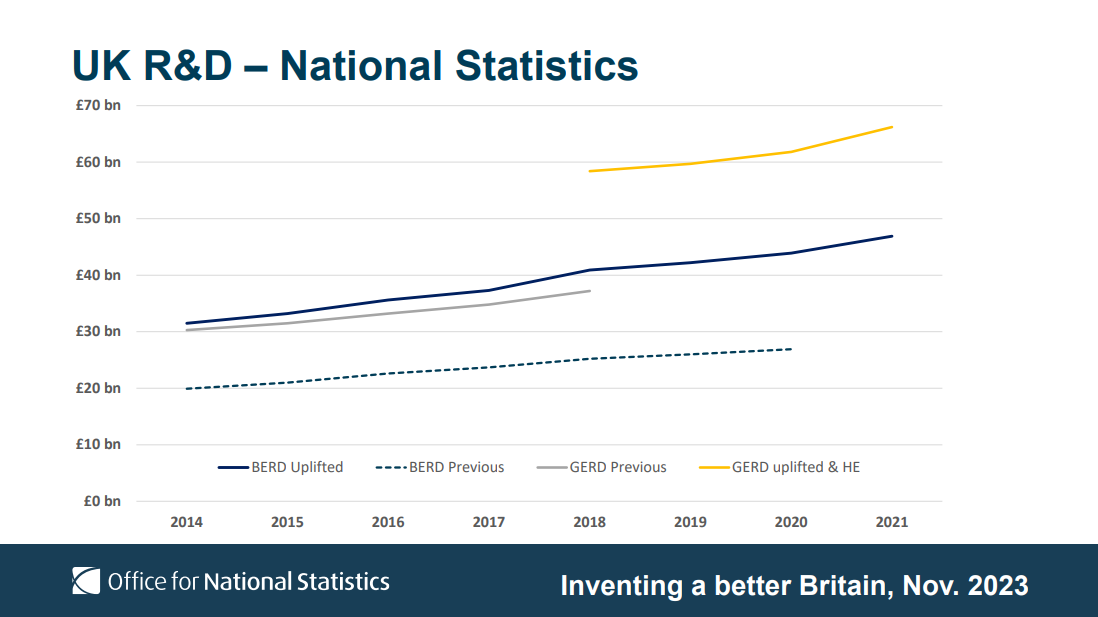 Figure 1. UK R&D – National Statistics (Source: ONS)